Education statistics | Literacy
Literacy Rate in India: State-Wise Literacy Rates and Rankings
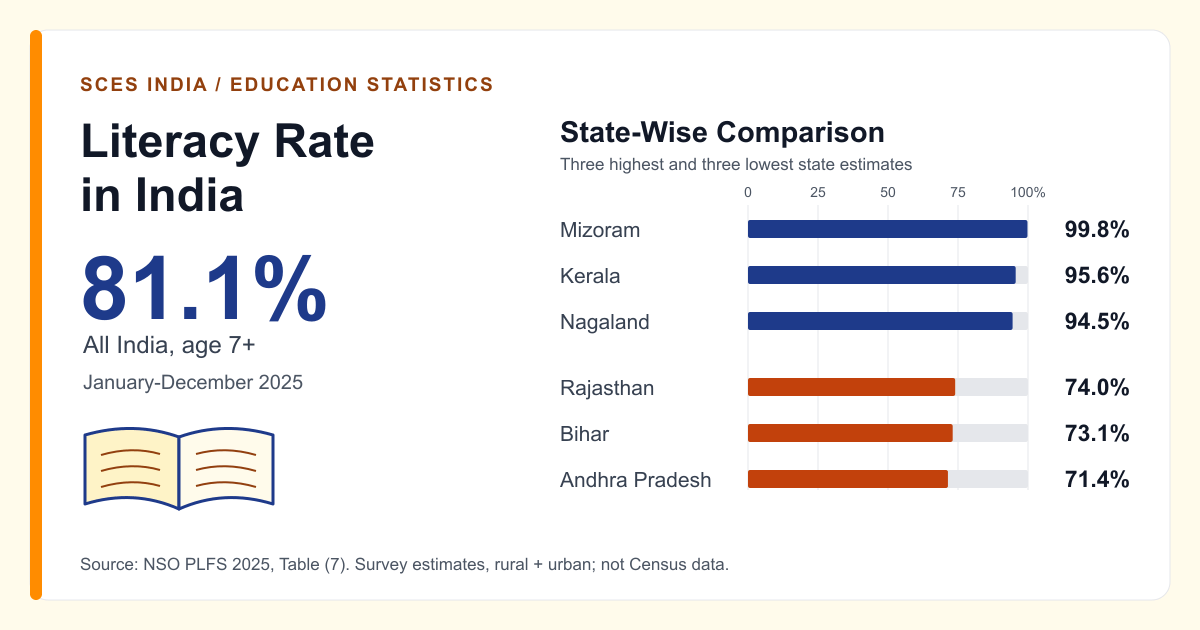
The literacy rate in India is 81.1% for people aged seven and above in the Periodic Labour Force Survey (PLFS) 2025. This is the newest comprehensive official state-wise literacy dataset independently verified for this article as of 19 November 2026. It covers January-December 2025 and was released in March 2026. It is a survey estimate, not a new Census literacy rate.
Reading and writing help people use classroom instructions, workplace notices, health information and public services. Literacy is therefore relevant to education, economic participation and social inclusion. But a national percentage can conceal unequal access. This guide compares all 28 states and eight Union Territories, then examines gender and residence gaps without treating literacy as a substitute for educational attainment or learning quality.
Understanding Literacy Rate in India
PLFS defines a literate person as someone who can both read and write a simple message with understanding in at least one language. The survey definition in Appendix C, paragraph 2.4 does not require a school certificate. The Census 2011 instructions similarly require reading and writing with understanding; reading alone or merely signing a name is insufficient.
Literacy rate (%) = 100 x literate people aged 7+ / total people aged 7+
For a survey, these are weighted estimated totals, not an unweighted count of interviewed respondents. Both numerator and denominator must refer to the same age group and population. Children younger than seven are excluded from this effective literacy rate; dividing by the entire all-age population would produce a different indicator. PLFS percentage estimates also exclude not-reported cases, as its estimation note explains.
Literacy is not the same as school enrolment, years of education, graduation, numeracy or digital proficiency. Someone can learn to read outside formal schooling, while school attendance alone does not establish reading comprehension. Parents interested in practice rather than population statistics can explore SCES's guide to helping a child learn to read.
Which Data Is Used, and How Was It Checked?
The main table uses only the age-seven-plus, rural-plus-urban panel of PLFS 2025 Table (7), published by NSO under MoSPI. The official release note is dated 27 March 2026. We used the revised PDF file dated 29 May 2026; a separate revision-announcement date was not verified. Publication year 2026 must not be confused with the survey reference year 2025.
Percentages were cross-checked against the original government workbook. PLFS sampled 270,472 households and 1,148,634 people across all ages; these are sample counts, not the seven-plus denominator or India's population. Coverage excludes extremely difficult-to-access villages in the Andaman and Nicobar Islands. Rural Chandigarh is absent from the survey frame, not assigned a zero rate.
Rankings below are our descending order of rounded point estimates, not an official league table or a test of statistically significant differences. Equal published percentages share a rank. Small territories warrant particular caution, and national totals are weighted estimates, not averages of state percentages. Persons totals include all reported genders; the male and female columns are the categories published separately by NSO.
Census Figures and Survey Estimates Are Different
The final Census 2011 national effective literacy rate is 72.98%, calculated from the final Primary Census Abstract counts. The often-repeated 74.04% belongs to the 2011 provisional results. Neither is a 2026 observation. The final PCA's original release date was not independently established here; its statistical reference remains 2011.
Census 2027 has been announced, but enumeration notices are not newly released literacy results. PLFS also changed its sampling and estimation design in January 2025 and explicitly warns that its 2025 estimates may not be strictly comparable with earlier PLFS reports. Do not turn the difference between two Census/survey percentages into an exact growth claim, or mix their geographical boundaries in one ranking.
State-Wise Literacy Rate in India: All States and UTs
All 36 current jurisdictions appear below. State and UT status is explicit: Delhi is a UT, Jammu and Kashmir and Ladakh have separate rows, and Dadra and Nagar Haveli and Daman and Diu is one merged UT. None has been backfilled using Census 2011 boundaries. India's national benchmark is 81.1%, not a ranked jurisdiction.
Rank compares states and UTs together using the same dataset. Ties share competition ranks, so the following rank is skipped. Rates are percentages, rounded to one decimal. On a narrow screen, focus the table and scroll horizontally.
| Rank | State / Union Territory | Type | Overall (%) | Male (%) | Female (%) | Source / Reference Period |
|---|---|---|---|---|---|---|
| 1 | Mizoram | State | 99.8 | 99.8 | 99.8 | PLFS 2025 Jan-Dec 2025 |
| 2 | Kerala | State | 95.6 | 96.9 | 94.4 | PLFS 2025 Jan-Dec 2025 |
| 3 | Puducherry | UT | 94.7 | 98.1 | 91.5 | PLFS 2025 Jan-Dec 2025 |
| 4 | Nagaland | State | 94.5 | 96.3 | 92.6 | PLFS 2025 Jan-Dec 2025 |
| 5 | Lakshadweep | UT | 93.8 | 97.3 | 91.0 | PLFS 2025 Jan-Dec 2025 |
| 6 | Meghalaya | State | 93.0 | 94.0 | 92.1 | PLFS 2025 Jan-Dec 2025 |
| 7 | Goa | State | 92.9 | 97.0 | 88.6 | PLFS 2025 Jan-Dec 2025 |
| 8 | Manipur | State | 92.3 | 95.9 | 88.8 | PLFS 2025 Jan-Dec 2025 |
| 9 | Chandigarh | UT | 91.1 | 94.7 | 87.0 | PLFS 2025 Jan-Dec 2025 |
| 10 | Himachal Pradesh | State | 89.8 | 94.0 | 85.9 | PLFS 2025 Jan-Dec 2025 |
| 11 | Tripura | State | 89.3 | 91.7 | 87.2 | PLFS 2025 Jan-Dec 2025 |
| 12 | Delhi | UT | 89.0 | 93.0 | 84.4 | PLFS 2025 Jan-Dec 2025 |
| 13 | Sikkim | State | 88.6 | 91.3 | 85.4 | PLFS 2025 Jan-Dec 2025 |
| 14 | Assam | State | 88.1 | 91.2 | 85.0 | PLFS 2025 Jan-Dec 2025 |
| 15 | Maharashtra | State | 88.0 | 93.2 | 82.4 | PLFS 2025 Jan-Dec 2025 |
| 16 | Andaman and Nicobar Islands | UT | 87.6 | 92.3 | 82.8 | PLFS 2025 Jan-Dec 2025 |
| 17 | Tamil Nadu | State | 87.2 | 92.0 | 82.7 | PLFS 2025 Jan-Dec 2025 |
| 18 | Dadra and Nagar Haveli and Daman and Diu | UT | 86.8 | 91.9 | 79.5 | PLFS 2025 Jan-Dec 2025 |
| 19 | Arunachal Pradesh | State | 86.4 | 91.0 | 81.6 | PLFS 2025 Jan-Dec 2025 |
| 20 | Uttarakhand | State | 84.6 | 90.6 | 78.6 | PLFS 2025 Jan-Dec 2025 |
| 20 | West Bengal | State | 84.6 | 88.7 | 80.7 | PLFS 2025 Jan-Dec 2025 |
| 22 | Gujarat | State | 84.5 | 91.4 | 77.4 | PLFS 2025 Jan-Dec 2025 |
| 23 | Haryana | State | 83.9 | 90.3 | 76.8 | PLFS 2025 Jan-Dec 2025 |
| 23 | Karnataka | State | 83.9 | 89.5 | 78.3 | PLFS 2025 Jan-Dec 2025 |
| 25 | Punjab | State | 82.2 | 86.3 | 77.8 | PLFS 2025 Jan-Dec 2025 |
| 26 | Chhattisgarh | State | 81.1 | 88.0 | 74.2 | PLFS 2025 Jan-Dec 2025 |
| 27 | Ladakh | UT | 80.6 | 89.1 | 71.7 | PLFS 2025 Jan-Dec 2025 |
| 27 | Odisha | State | 80.6 | 86.4 | 75.1 | PLFS 2025 Jan-Dec 2025 |
| 29 | Jharkhand | State | 79.5 | 86.1 | 73.1 | PLFS 2025 Jan-Dec 2025 |
| 30 | Jammu and Kashmir | UT | 79.4 | 86.8 | 71.6 | PLFS 2025 Jan-Dec 2025 |
| 31 | Madhya Pradesh | State | 77.4 | 84.8 | 69.8 | PLFS 2025 Jan-Dec 2025 |
| 32 | Uttar Pradesh | State | 77.2 | 85.3 | 69.3 | PLFS 2025 Jan-Dec 2025 |
| 33 | Telangana | State | 74.6 | 81.7 | 67.6 | PLFS 2025 Jan-Dec 2025 |
| 34 | Rajasthan | State | 74.0 | 84.5 | 63.7 | PLFS 2025 Jan-Dec 2025 |
| 35 | Bihar | State | 73.1 | 81.0 | 65.5 | PLFS 2025 Jan-Dec 2025 |
| 36 | Andhra Pradesh | State | 71.4 | 77.7 | 65.5 | PLFS 2025 Jan-Dec 2025 |
Source: NSO Table (7), printed page A-10 / PDF page 87. All overall, male and female values come from this single combined panel.
Three Highest and Three Lowest States
- Mizoram99.8%
- Kerala95.6%
- Nagaland94.5%
- Rajasthan74.0%
- Bihar73.1%
- Andhra Pradesh71.4%
Which Indian State Has the Highest Literacy Rate?
Mizoram leads states at 99.8% in PLFS 2025. Its male and female estimates are both 99.8% at the published precision. Kerala follows at 95.6%, then Nagaland at 94.5%. Among UTs, Puducherry leads at 94.7%, ahead of Lakshadweep's 93.8%. These answers come from the same age-seven-plus table.
For a question specifically about Census 2011, Kerala was the leading state at 94.00% under that Census's geography. That historical answer remains valid, but it is not the leading-state answer for the newer PLFS series. A programme's "full literacy" declaration is another, separately defined indicator.
Which Indian State Has the Lowest Literacy Rate?
Andhra Pradesh is lowest among states at 71.4% in PLFS 2025. Bihar follows at 73.1% and Rajasthan at 74.0%. Andhra Pradesh's male estimate is 77.7% and female estimate 65.5%. Among UTs, Jammu and Kashmir is lowest at 79.4%.
Bihar was the lowest state in final Census 2011 figures at 61.80%; that is a different-period answer. Low population literacy does not mean every school in a state performs poorly, and it cannot by itself diagnose current classroom quality, dropout or the reasons individuals missed schooling.
Male vs Female Literacy Rate in India
The national male literacy rate is 87.5% and female literacy rate is 74.9% in PLFS 2025. The difference is 12.6 percentage points. This is a subtraction of two rates, not a relative percentage increase or a count of people.
Rajasthan has the widest state gender gap: 84.5% male versus 63.7% female, a 20.8-point difference. Ladakh's 89.1% versus 71.7% gives the widest UT gap, 17.4 points. Mizoram's published male and female rates are equal, while Kerala's 96.9% and 94.4% differ by 2.5 points. Equality after rounding does not prove exact equality in the underlying population.
Because the indicator includes older adults, disparities reflect accumulated differences across generations, not only today's pupils. Improving girls' schooling and supporting women who missed school are complementary tasks, but these cross-sectional percentages do not establish the effect of any particular intervention.
Rural vs Urban Literacy in India
| Residence | Overall (%) | Male (%) | Female (%) |
|---|---|---|---|
| Rural | 77.4 | 84.8 | 70.3 |
| Urban | 89.0 | 93.1 | 84.8 |
| Rural + Urban | 81.1 | 87.5 | 74.9 |
Urban literacy is 89.0%, compared with 77.4% in rural areas: an 11.6-point gap. Rural women's 70.3% and urban women's 84.8% differ by 14.5 points. Within rural areas, the male-female gap is 14.5 points; within urban areas it is 8.3. Residence and gender therefore need to be examined together.
Telangana has the largest state residence gap in this table: 86.0% urban versus 66.4% rural, or 19.6 points. Do not assume urban areas always lead: Lakshadweep's rural estimate is 97.4%, above its urban 93.0%. Such small-area estimates require the sampling cautions described earlier. Source: Table (7), rural and urban panels.
Regional Literacy Trends Across India
Regional labels can hide considerable variation. The following are illustrative state comparisons from PLFS 2025, not official regional averages or claims that geography causes literacy outcomes:
- South: Kerala's 95.6% and Tamil Nadu's 87.2% contrast with Telangana's 74.6% and Andhra Pradesh's 71.4%. A blanket "high-literacy South" description misses these differences.
- Northeast: Mizoram has 99.8%, Nagaland 94.5%, Meghalaya 93.0% and Arunachal Pradesh 86.4%. The published state estimates vary.
- North and north-central examples: Himachal Pradesh has 89.8%, Uttarakhand 84.6%, Punjab 82.2% and Uttar Pradesh 77.2%.
- East: West Bengal's 84.6% exceeds Odisha's 80.6%, Jharkhand's 79.5% and Bihar's 73.1%.
- West and central examples: Goa records 92.9%, Maharashtra 88.0%, Gujarat 84.5%, Chhattisgarh 81.1% and Madhya Pradesh 77.4%.
A simple average of these state percentages would give small and large states equal weight. It would not be a population-weighted regional literacy rate. Age composition, residence and gender distributions also matter when interpreting differences; the table alone cannot separate their contributions.
Factors Affecting Literacy Rates in India
The literacy table describes differences, not their causes. NEP 2020 and Samagra Shiksha identify access, inclusion and learning support as policy priorities. When assessing a local community, relevant questions include:
- School access and infrastructure: Are schools reachable, buildings accessible, and facilities appropriate for girls and children with disabilities?
- Poverty and time costs: Can families manage transport, materials, irregular work schedules and the time needed for continued study?
- Gender inequality: Do girls and adult women have safe, practical opportunities to attend, return to education and practise reading?
- Teacher availability and support: Is sustained instruction available, with training and help for learners who fall behind or speak a different home language?
- Digital accessibility: Are devices, connectivity, accessible formats and suitable learning materials available, rather than merely an online portal?
These are needs to investigate, not explanations proven for every low-ranked state. SCES's discussions of supporting children's education in Delhi and digital learning access provide local context; they are not sources for national literacy estimates.
Government Initiatives to Improve Literacy
Samagra Shiksha
Samagra Shiksha treats school education as a continuum from pre-school to senior secondary. Its objectives include access, equity, inclusion, learning outcomes, foundational literacy and numeracy, and teacher capacity. These describe intended support, not measured effects on the state ranking.
National Education Policy 2020 and NIPUN Bharat
NEP 2020 prioritises foundational reading, writing and numeracy and adult education. Its original universal-FLN goal for 2025 is a policy target, not confirmation of achievement. NIPUN Bharat supports early-years foundational learning under Samagra Shiksha. A population literacy percentage and a child's assessed foundational proficiency should not be treated as the same result.
ULLAS / New India Literacy Programme
The New India Literacy Programme, known as ULLAS, targets non-literate people aged 15 and above during FY 2022-23 to FY 2026-27. Its five components are foundational literacy and numeracy, critical life skills, vocational skills development, basic education and continuing education. This extends adult learning beyond recognising letters, including practical financial and digital skills.
PM SHRI
PM SHRI is intended to develop selected existing schools as examples of NEP implementation, with quality, equitable and inclusive education and mentoring for neighbouring schools. Its planned activities do not establish that it caused a change in population literacy.
What Does "Full Literacy" Mean?
The Ministry's full-literacy benchmark allows 95% to count as fully literate, not literal 100%. The Tripura declaration explicitly concerns the age-15-plus benchmark. Programme surveys, assessments and declarations can have different age coverage and methods, so their figures are not substituted into this age-seven-plus PLFS ranking.
Challenges and the Future of Literacy in India
The central challenge is not simply raising a headline percentage: it is reaching people missed by earlier schooling while helping children develop usable comprehension. Adult learning needs practical schedules and continued practice; foundational teaching needs regular feedback, suitable languages and materials, and support for learners with disabilities.
Future monitoring should report age, gender and residence breakdowns, document survey-design changes, and keep Census, school-enrolment, learning-assessment and programme-certification data distinct. Until comparable evidence is available, neither a universal-literacy forecast year nor a scheme's claimed contribution should be inferred from two rates. Readers seeking practical involvement can find real SCES teaching and tutoring opportunities; that local action should not be presented as proof of a nationwide statistical effect.
Frequently Asked Questions
What is the literacy rate in India?
PLFS 2025 estimates 81.1% for people aged seven and above, referring to January-December 2025. Final Census 2011 records 72.98%; the figures come from different methods and periods.
Which Indian state has the highest literacy rate?
Mizoram leads PLFS 2025 at 99.8%. Kerala was highest in final Census 2011 at 94.00%. Specify the dataset when answering.
Which state has the lowest literacy rate in India?
Andhra Pradesh is lowest in PLFS 2025 at 71.4%. Bihar was lowest under final Census 2011 geography at 61.80%. These are not interchangeable rankings.
What are the male and female literacy rates in India?
For age seven-plus in PLFS 2025, male literacy is 87.5% and female literacy is 74.9%, a 12.6-percentage-point gap.
Which Union Territory has the highest literacy rate?
Puducherry leads UTs at 94.7% in PLFS 2025, followed by Lakshadweep at 93.8%. This is the same reference period used for the state table.
How is India's literacy rate calculated?
Divide literate people aged seven-plus by the corresponding seven-plus population and multiply by 100. PLFS uses weighted estimates excluding not-reported cases. Reading and writing with understanding are required.
What is the difference between Census literacy data and survey estimates?
A Census enumerates the population; PLFS estimates from a probability household sample. Reference dates, frames, weights and geographic units matter. Neither programme certificates nor later publication dates automatically create a comparable new literacy rate.
Does "full literacy" mean everyone is literate?
No. The Ministry allows the 95% programme benchmark to count as full literacy. Its adult-learning/declaration context is different from the age-seven-plus PLFS indicator.
Conclusion: Reading the Literacy Rate in India Correctly
The literacy rate in India is best understood with its source attached: 81.1% in PLFS 2025, age seven-plus. Mizoram's 99.8% and Andhra Pradesh's 71.4% mark the state extremes in this survey, while national gender and rural-urban gaps remain substantial. The useful lesson is not a timeless league table. It is to identify where access and learning support need attention, use consistent evidence, and distinguish basic literacy from the broader education people need to participate confidently in society.
Sources and References
Primary sources below support the statistics and programme descriptions. SCES did not conduct the surveys or attribute their results to its own work.
- NSO Annual Report PLFS 2025. January-December 2025; released 27 March 2026. Table (7), PDF pp. 85-87; definition p. 549; comparison warning p. 38. Revised file dated 29 May 2026.
- Original MoSPI Table (7) workbook. Age seven-plus columns B, D and F; combined panel rows 94-130. All 36 areas cross-checked against the PDF.
- Official PLFS 2025 release note. Dated 27 March 2026 inside the document; filename dates are not substituted for release dates.
- Census 2011 final Primary Census Abstract. Reference 2011; national Data rows 2-4. Effective rates computed from literates and population aged seven-plus. Original final release date not independently established.
- Census 2011 provisional population presentation. 31 March 2011; literacy slide 44. Not the final PCA percentages.
- Census 2011 literacy instructions. Paragraphs 6.80-6.82, printed p. 56 / PDF p. 61; Census reference 2011.
- MHA announcement of Census 2027. 4 June 2025; identifies 2011 as the last Census. Subsequent schedules are not new literacy results.
- Official Samagra Shiksha overview. Undated Ministry overview; integrated school-education objectives, not an impact evaluation.
- National Education Policy 2020. Policy reference 2020; paragraphs 2.2 and 21.4-21.5. The migrated file path does not change the policy year.
- Parliamentary reply on the New India Literacy Programme. 29 March 2023; target age 15+, FY 2022-23 to FY 2026-27, five components.
- Ministry explanation of the full-literacy benchmark. 28 August 2024; 95% policy benchmark and broader literacy conception, not literal 100%.
- Tripura literacy declaration: age-group qualification. 23 June 2025; explicitly describes the age-15-plus declaration benchmark. Kept out of the survey ranking.
- Cabinet approval of PM SHRI schools. 7 September 2022; selected exemplar schools and mentoring objectives, not proven population-literacy impact.
- Current parliamentary explanation of NIPUN Bharat. 27 July 2026; early-years foundational literacy and numeracy objective.
Census retrieval note: the live archive was intermittently unreachable during an additional historical-state check. Kerala and Bihar's final PCA counts were checked using a preserved copy of the exact official workbook, with archive-digest and national-count cross-checks. The capture date is not a publication or statistical reference date.
Editorial method: this article was prepared with AI-assisted research and writing, with statistics cross-checked against the official sources listed above.